What are the weaknesses associated with using histogram metrics in fraud detection?
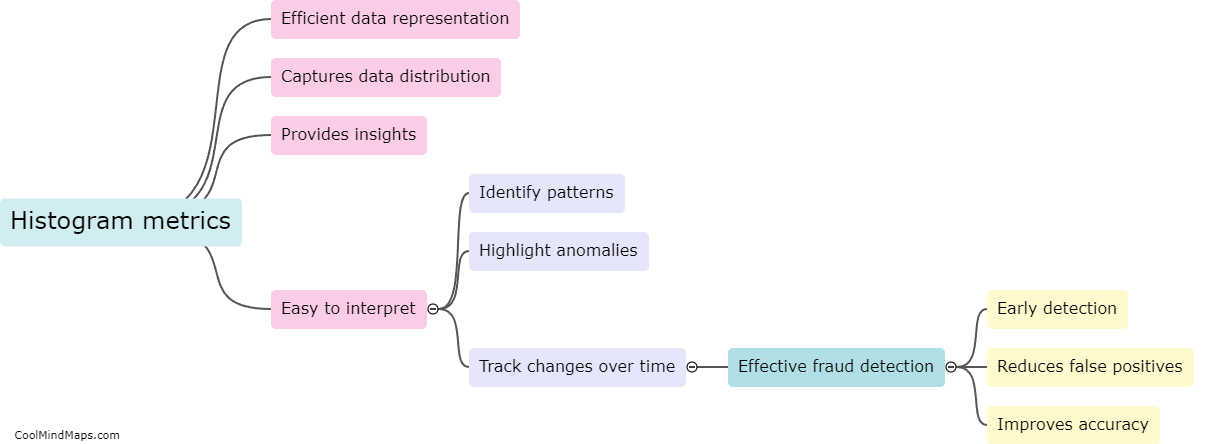
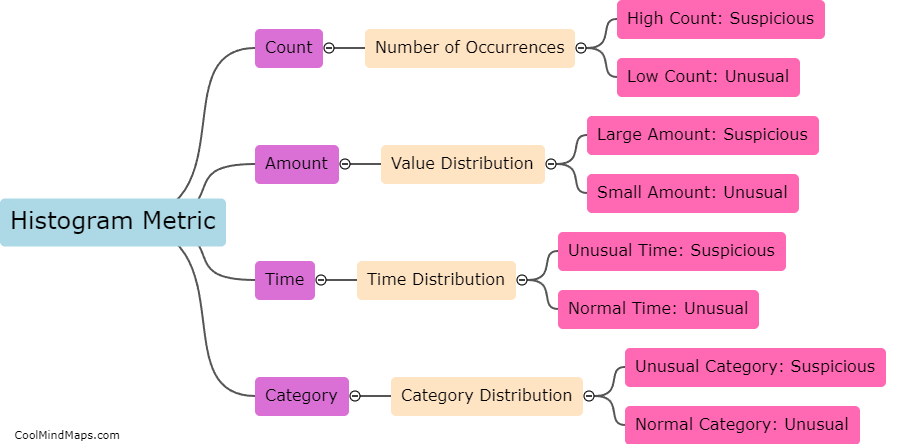
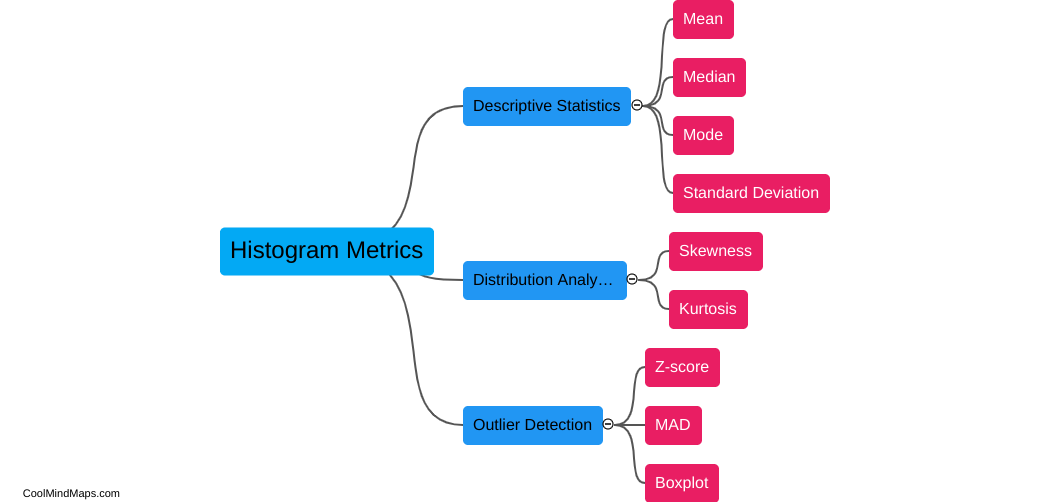
While histogram metrics can be a valuable tool for detecting fraud, they do have certain weaknesses that need to be considered. Firstly, histograms provide a summary of data distribution by dividing it into bins, which may result in loss of specific data points and granularity. This loss of individual data points can lead to the overlooking of certain fraudulent activities that may not be captured within the predetermined bins. Additionally, histograms rely on the assumption that the data is normally distributed, which might not hold true in all cases of fraud detection. This can result in inaccurate representations of the data and hinder the detection of anomalies. Furthermore, since histograms are based on predefined bins, they may not adjust well to changing patterns or new types of fraudulent activities, making them less adaptable to evolving fraud tactics. Overall, while histograms provide a useful visual representation of data distribution, their limitations in capturing fine-grained information and adaptability must be acknowledged in the context of fraud detection.

This mind map was published on 10 November 2023 and has been viewed 86 times.