What is an anchor chart?
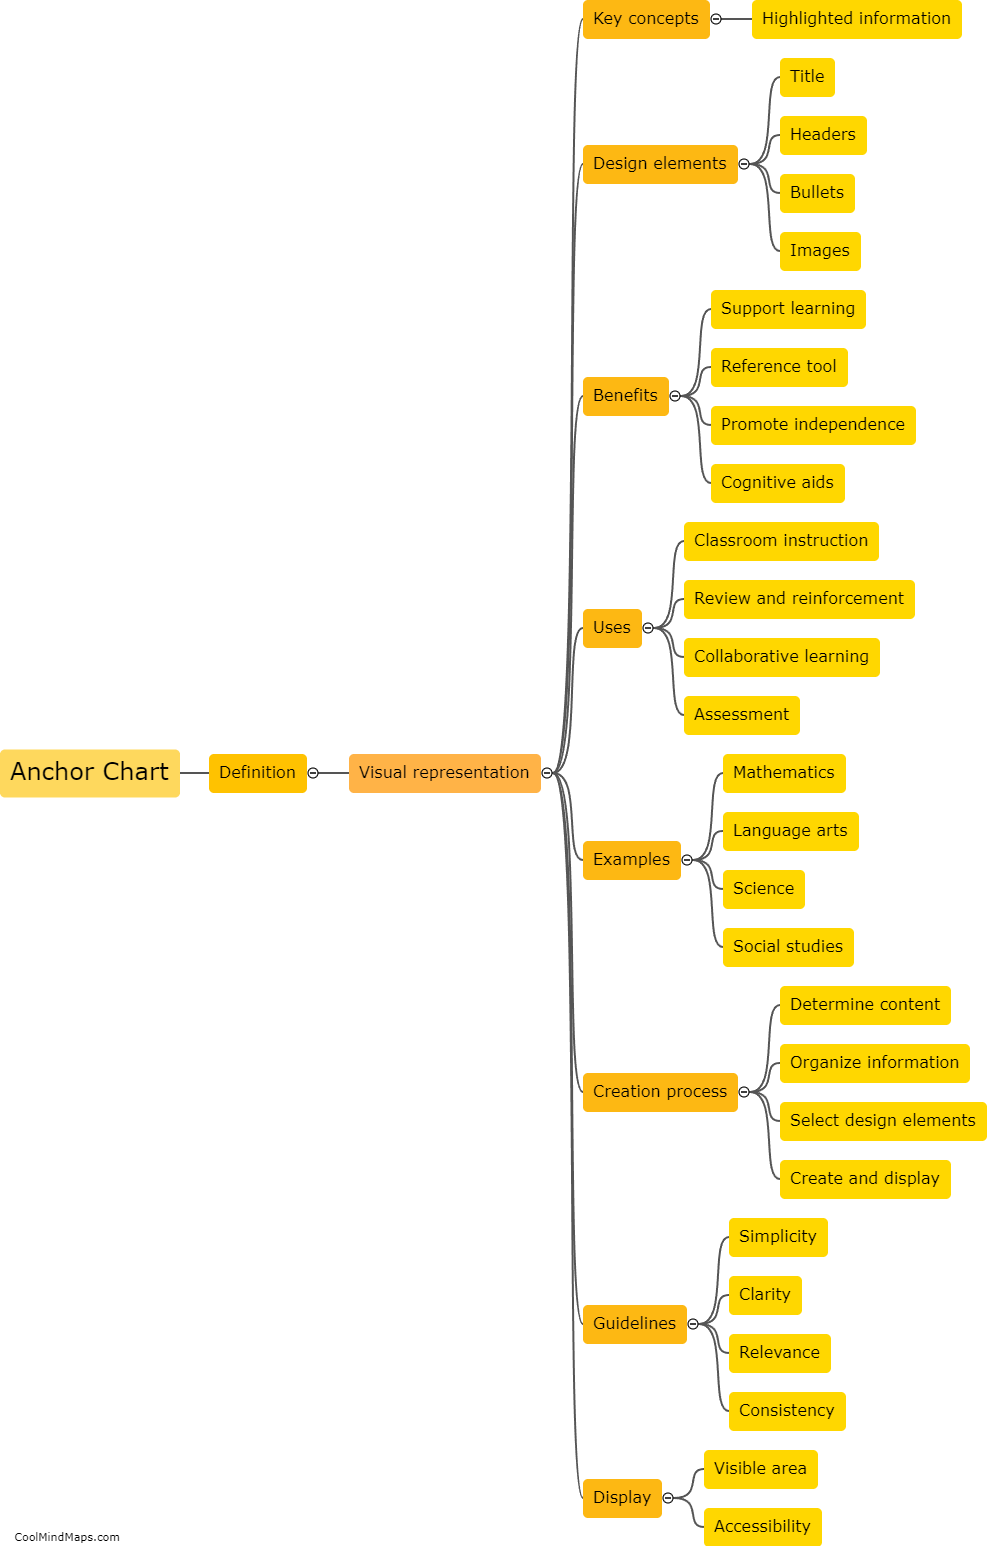
An anchor chart is a visual tool used in classrooms to support teaching and learning. It is usually a large poster-sized chart that provides information, examples, and reminders about a specific topic or concept. Anchor charts are created collaboratively by the teacher and students during a lesson or unit, with input from everyone to ensure understanding and engagement. These charts are then displayed on the wall or bulletin board, serving as a reference point throughout the learning process. They can include text, diagrams, pictures, and other visuals to help students better comprehend and remember important information. Anchor charts are commonly used to reinforce vocabulary, summarize key ideas, and provide step-by-step processes.
This mind map was published on 16 November 2023 and has been viewed 91 times.

