What is a Power BI report?
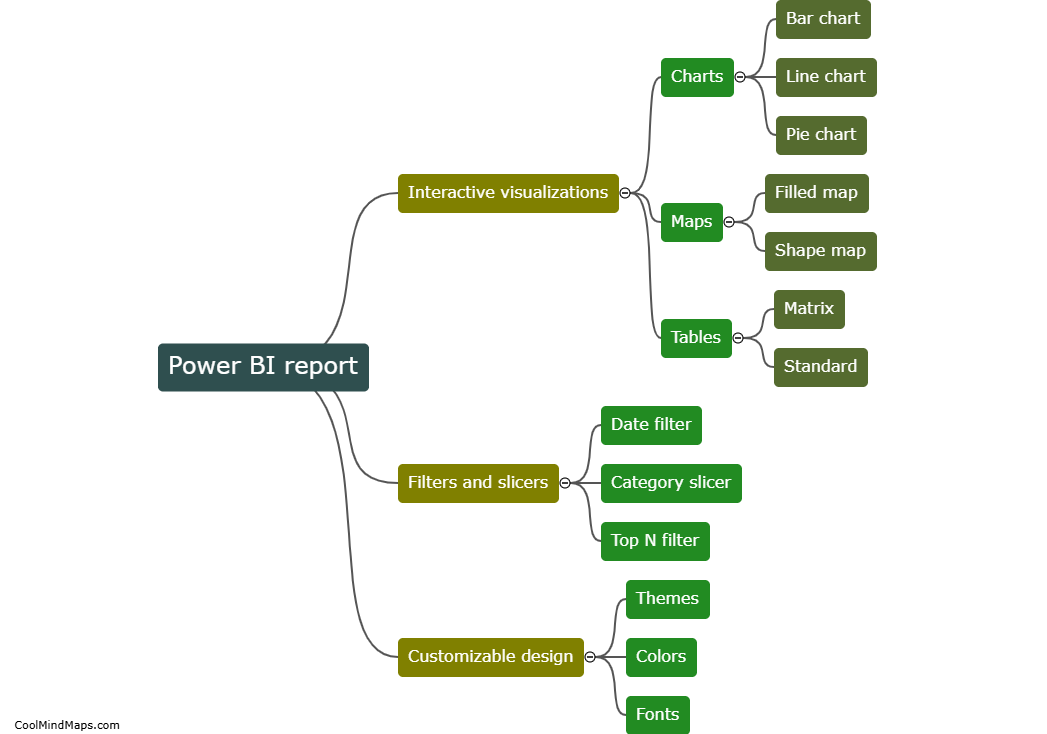
A Power BI report is a data visualization tool that allows users to create interactive and visually engaging reports from their data sources. These reports can include charts, graphs, tables, and other visual elements to help users gain insights and make informed decisions based on their data. Power BI reports can be shared and accessed online, making it easy for teams to collaborate and stay informed on key metrics and trends within their organization.
This mind map was published on 25 September 2024 and has been viewed 29 times.
