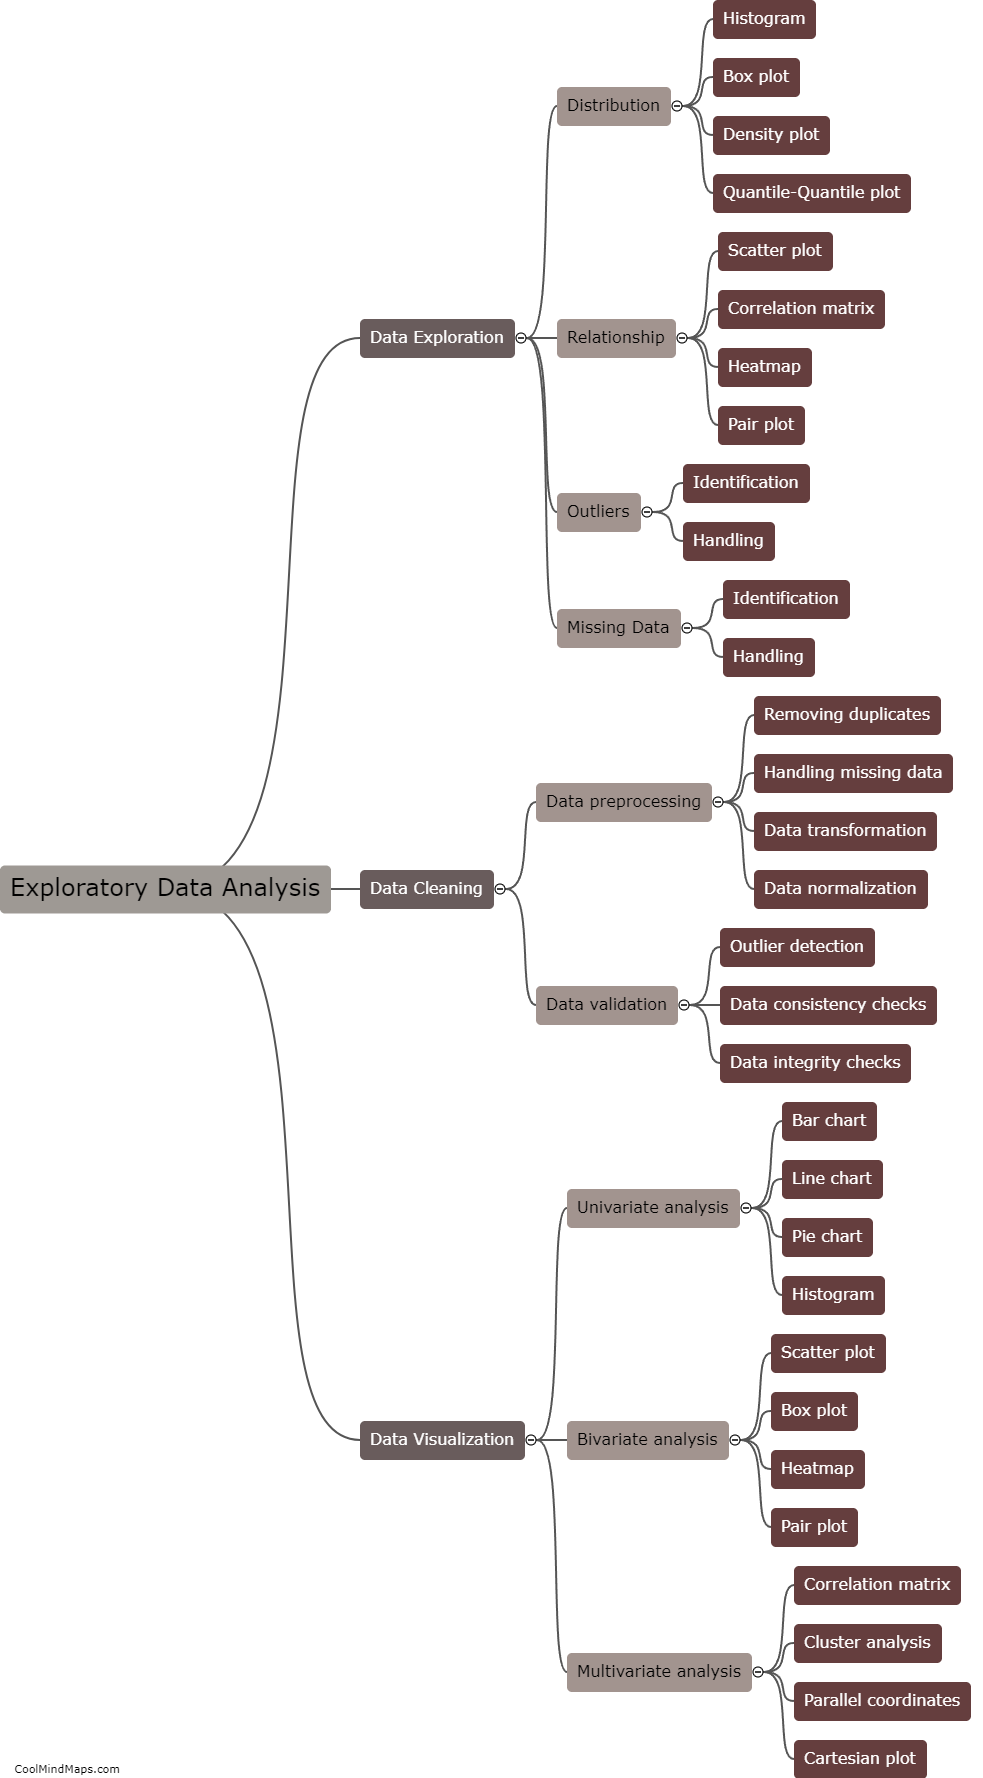
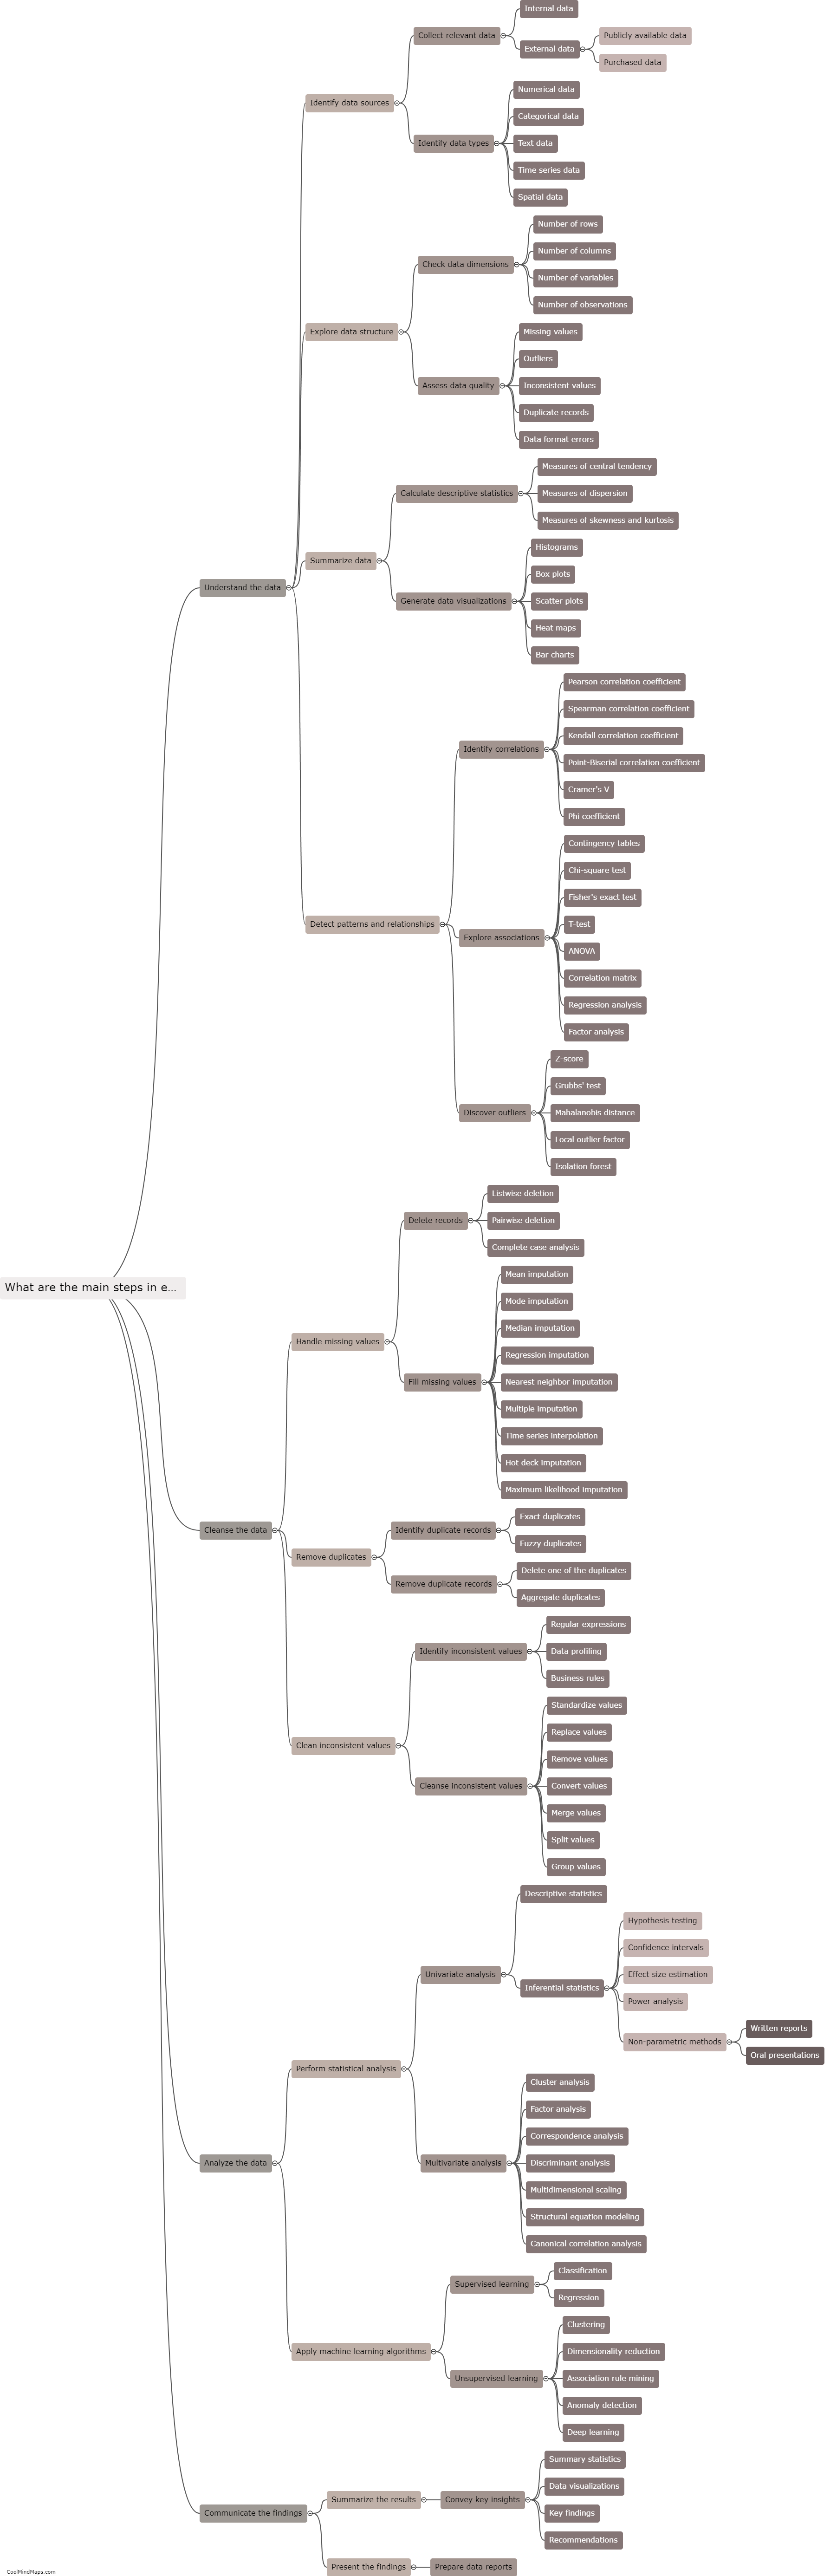
What are the common visualizations used in exploratory data analysis?
In exploratory data analysis (EDA), various visualizations are commonly employed to gain insights into the dataset. Histograms are one of the most basic and frequently used plots to reveal the distribution of a single variable. Scatter plots help to understand the relationship between two variables, indicating trends, patterns, or correlations. Box plots offer a visual representation of the distribution, spread, and outliers within a variable or group. Heatmaps are effective in displaying the correlation strength among multiple variables using colors. Bar charts are useful to compare categories or groups, while line plots display trends over time or continuous variables. Violin plots combine the features of box plots and density plots, providing a representation of distribution shape and summary statistics simultaneously. These visualizations, among others, aid in uncovering patterns, outliers, and potential relationships, facilitating a comprehensive exploration of the data.

This mind map was published on 5 October 2023 and has been viewed 101 times.