What are common data visualization tools in R?
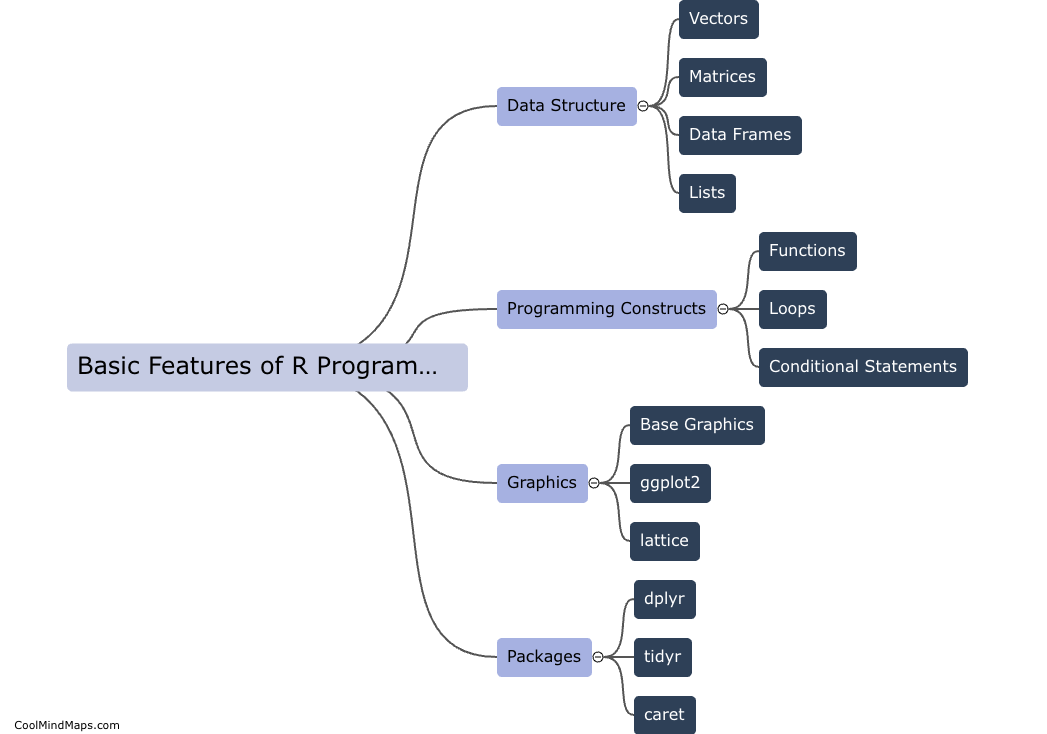
R offers a wide range of data visualization tools that are commonly used by data analysts and scientists. Some of the popular data visualization packages in R include ggplot2, plotly, ggvis, lattice, and an interactive web-based tool called Shiny. These tools provide users with the ability to create interactive and static visualizations such as scatter plots, bar charts, line graphs, heatmaps, and more. With a combination of these tools, users can effectively communicate and explore their data in a clear and visually appealing manner.

This mind map was published on 15 May 2024 and has been viewed 75 times.
