How can a CMDB health dashboard be implemented in ServiceNow?
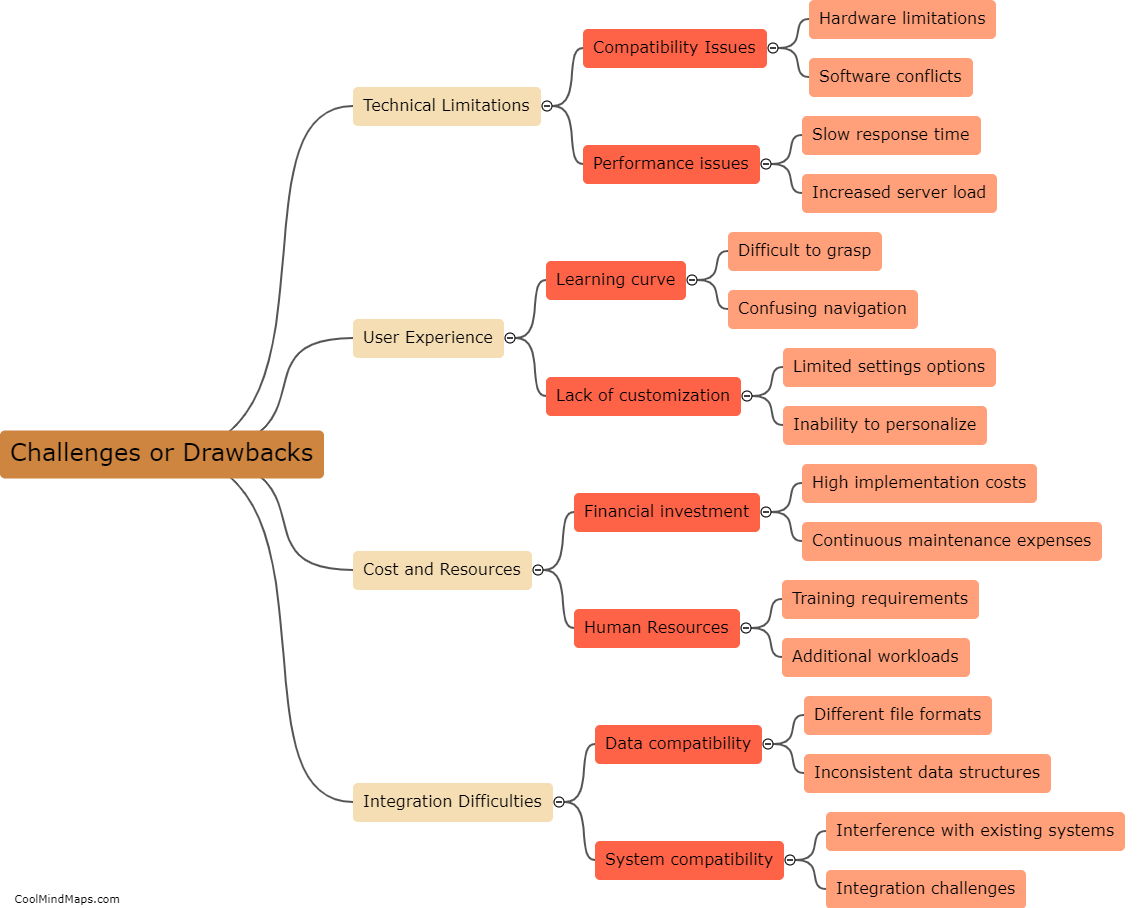
A CMDB (Configuration Management Database) health dashboard can be implemented in ServiceNow by following a few steps. First, it is essential to define the key metrics that will be monitored on the dashboard, such as the accuracy of CI (Configuration Item) data, the number of duplicate or inactive CIs, and the compliance level of CI relationships. These metrics will provide an understanding of the CMDB's health and help identify any gaps or issues that need improvement. Next, ServiceNow's reporting and dashboarding capabilities can be utilized to visualize these metrics in a user-friendly format. The dashboard can be customized to have widgets and charts that reflect the current state of the CMDB's health, and drill-down capabilities can be added to investigate specific issues in more detail. Automation can also play a role by periodically updating the dashboard with the latest metrics, ensuring real-time monitoring of the CMDB's health. Ultimately, implementing a CMDB health dashboard in ServiceNow enhances the visibility and management of configuration data, leading to improved IT service management processes.

This mind map was published on 20 January 2024 and has been viewed 129 times.

