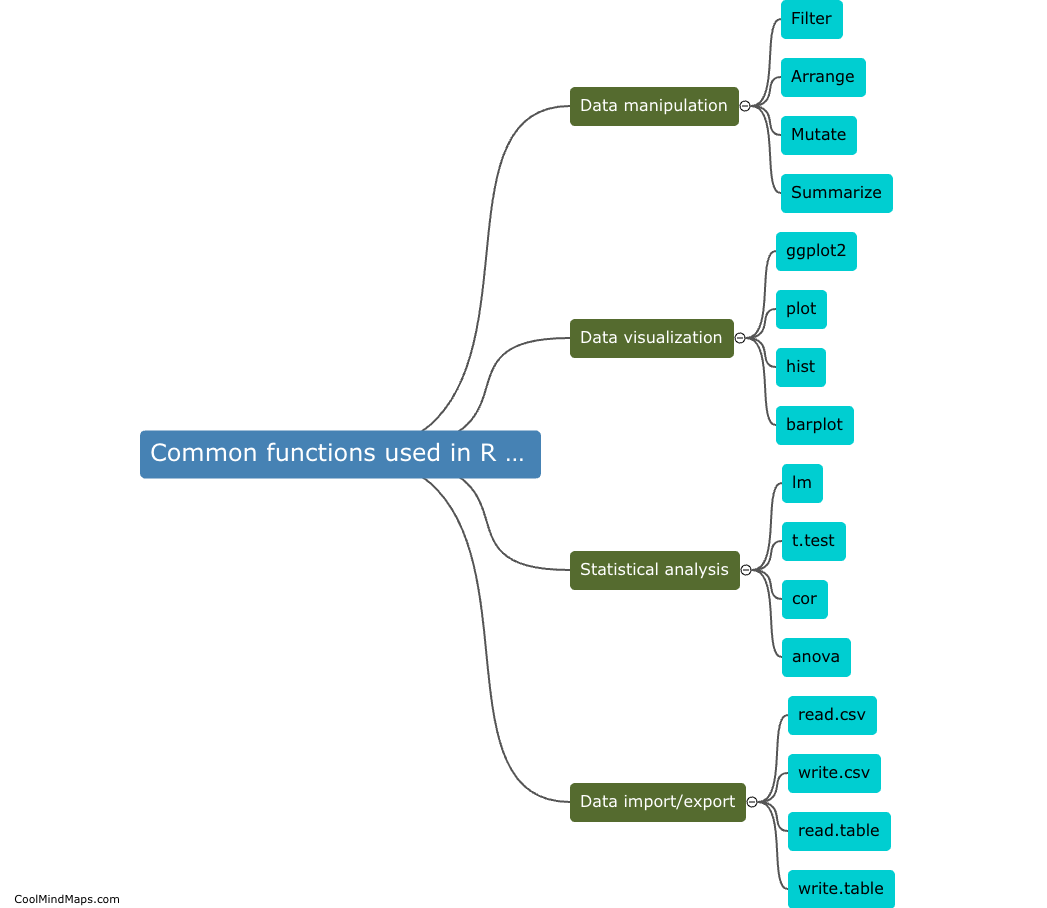
How can I create plots and visuals in R?
In R, creating plots and visuals is made easy through the use of various packages such as ggplot2, plotly, and lattice. These packages offer a wide range of functions and customization options to help users generate high-quality and visually appealing plots. By utilizing functions such as ggplot() or plot_ly(), users can easily input their data and specify the aesthetics, colors, and labels to create their desired visualizations. Additionally, by familiarizing oneself with the syntax and capabilities of these packages, users can efficiently create professional-looking plots for data analysis and presentation purposes.

This mind map was published on 15 May 2024 and has been viewed 72 times.