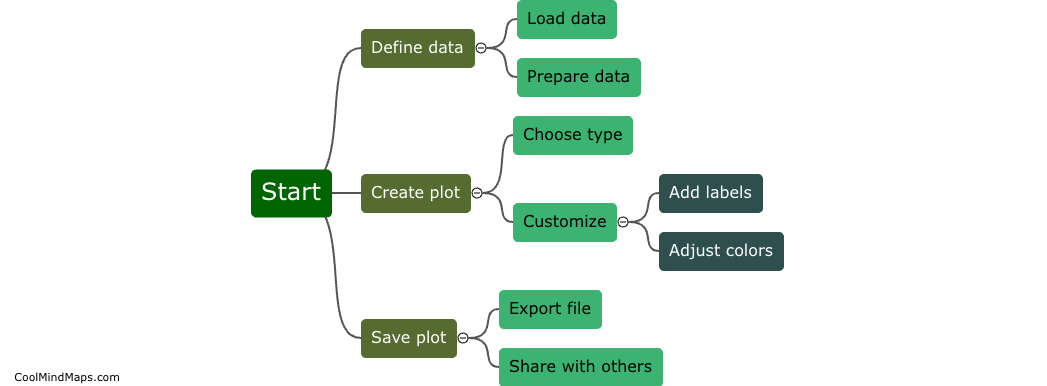
What are the common functions used to customize plots in R?
In R, there are several common functions that can be used to customize plots and enhance their appearance. These functions include plot(), which generates basic plots, and functions like title(), axis(), and legend() that add titles, axis labels, and legends to plots respectively. Other functions like lines(), points(), and abline() can be used to add lines, points, and reference lines to plots. Additionally, functions like par() can be used to customize various plot parameters such as colors, line styles, and text sizes. Overall, these functions provide users with the flexibility to create visually appealing and informative plots in R.

This mind map was published on 15 May 2024 and has been viewed 87 times.