What is the LM curve?
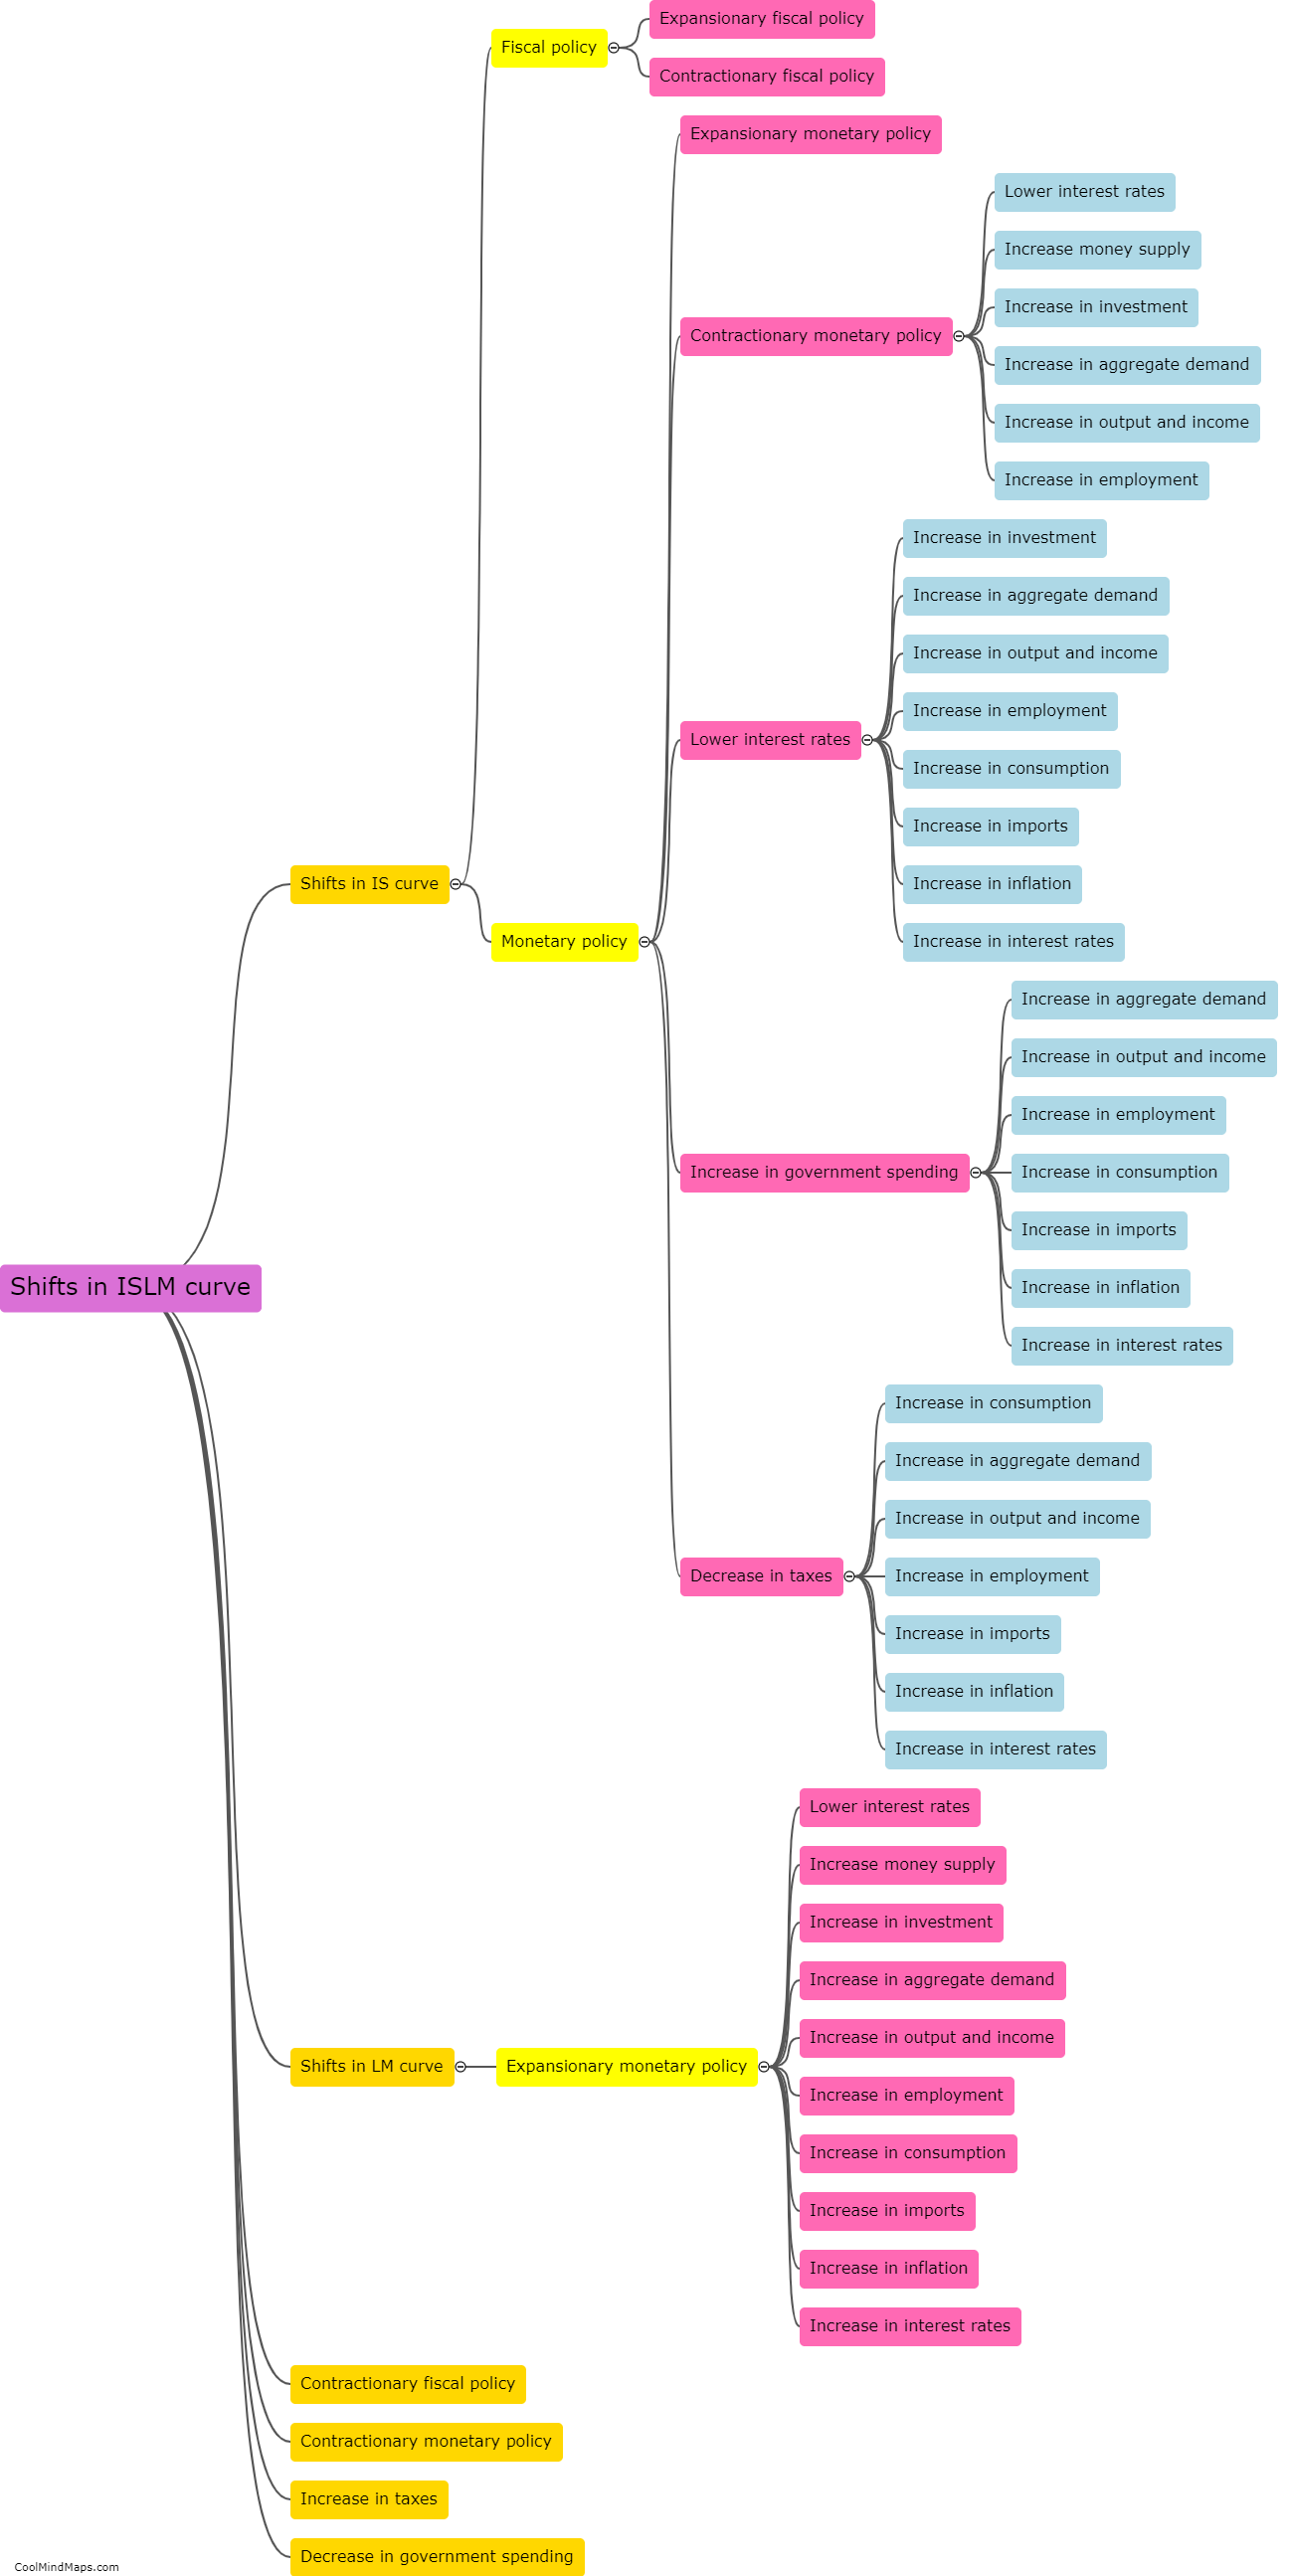
The LM curve represents the equilibrium in the money market in macroeconomics. It illustrates the combinations of interest rates and real income levels at which the demand for money equals the supply of money. The curve slopes upwards as an increase in income leads to an increase in the demand for money. The position of the LM curve is determined by monetary policy, specifically the monetary supply and the interest rate set by the central bank. A shift in the LM curve shows a change in the money supply or the perception of the desired level of liquidity by individuals and firms, influencing the equilibrium interest rate and real income level in the economy.

This mind map was published on 29 September 2023 and has been viewed 100 times.