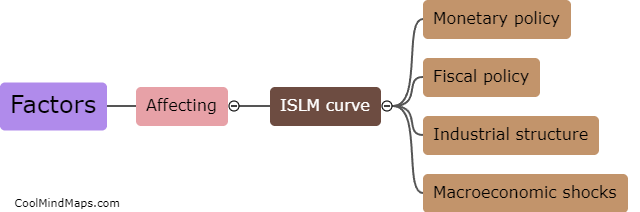
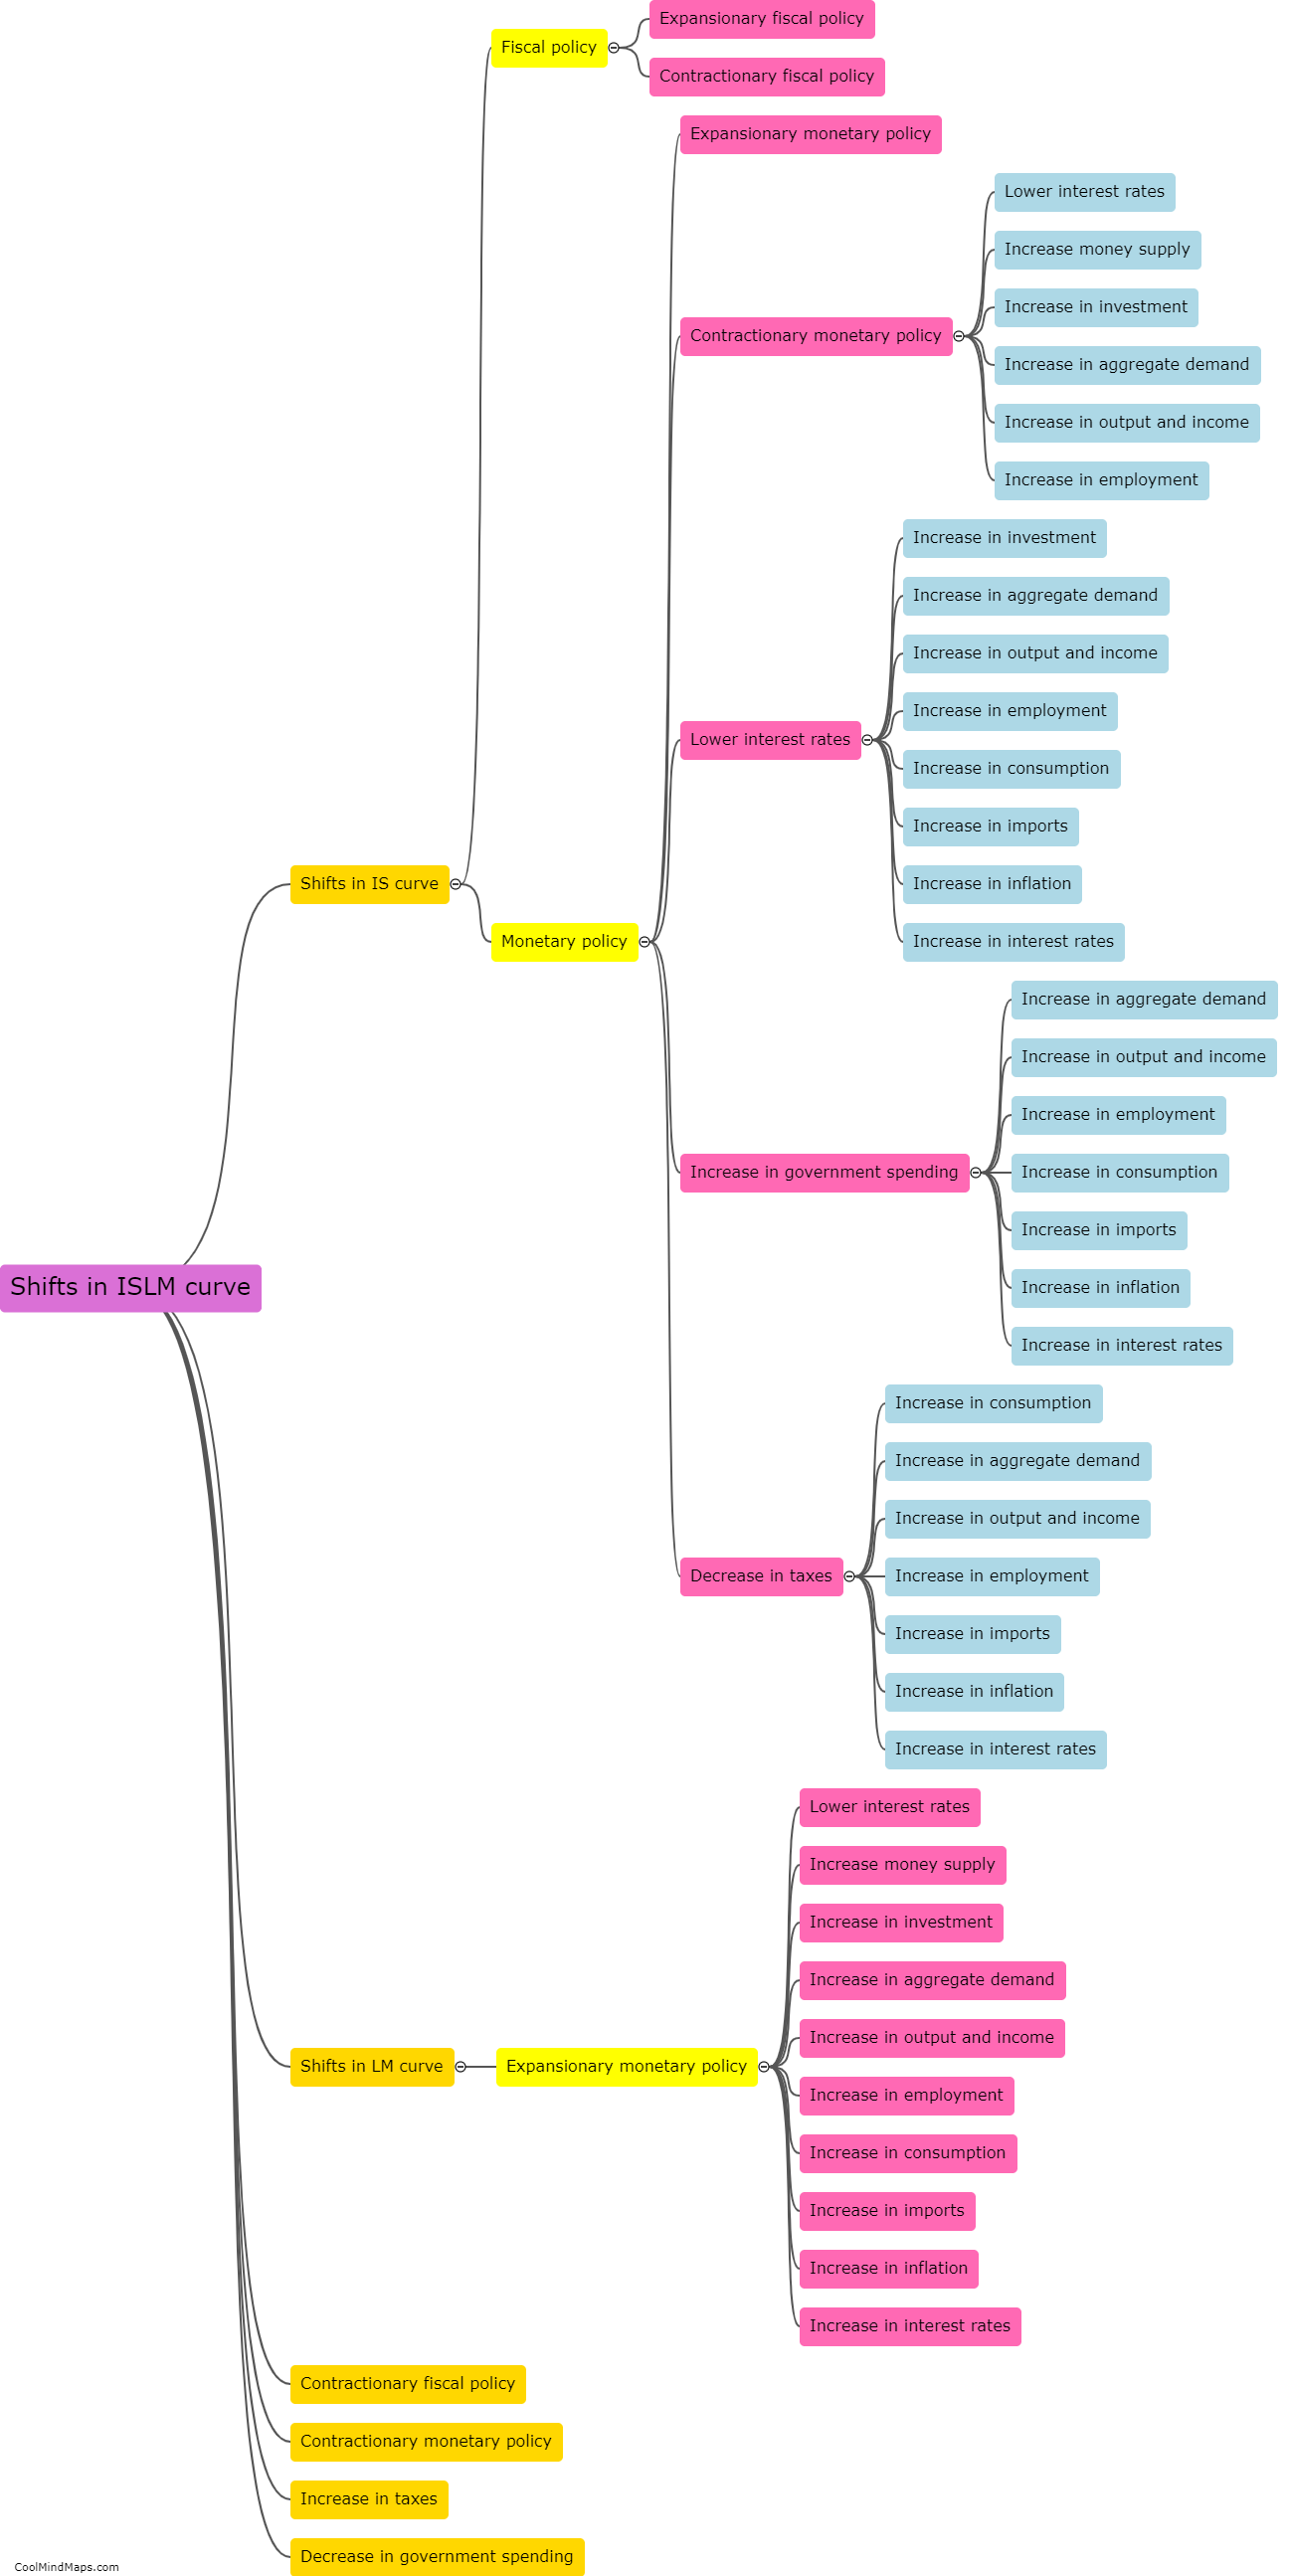
How does the ISLM curve represent the relationship between interest rates and output?
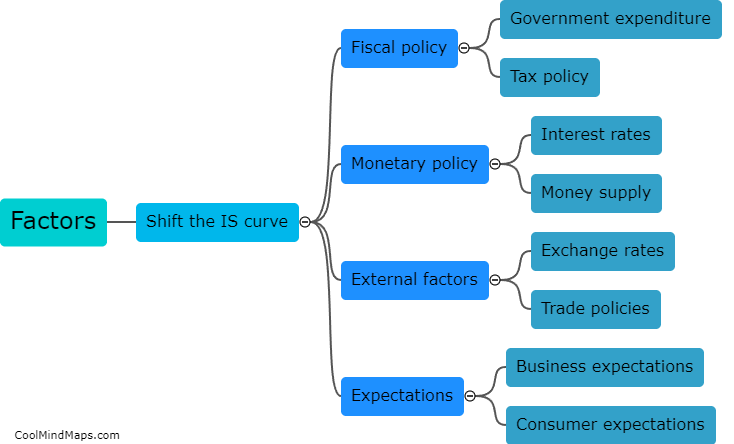
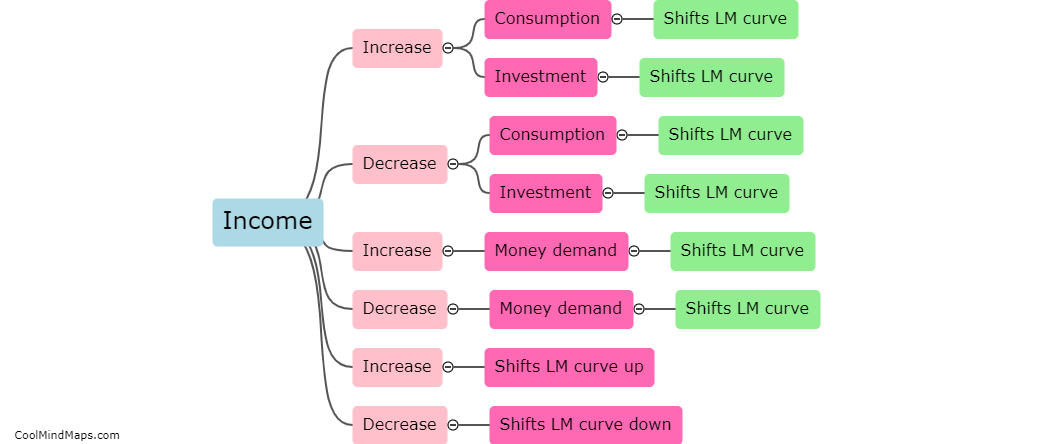
The ISLM curve represents the relationship between interest rates and output in an economy. It is a graphical representation that shows the equilibrium point where goods and money markets intersect. The IS curve, or the investment-savings curve, represents the equilibrium in the goods market, depicting the relationship between output and interest rates. A higher interest rate increases the cost of borrowing for investment, reducing investment and decreasing output. Conversely, a lower interest rate reduces the cost of borrowing, stimulating investment and increasing output. On the other hand, the LM curve, or the liquidity money curve, represents the equilibrium in the money market, showing the relationship between interest rates and the demand for money. When interest rates decrease, the demand for money increases, leading to an increase in output to meet the demand, thereby shifting the LM curve to the right. Conversely, when interest rates increase, the demand for money decreases, reducing output and shifting the LM curve to the left. The intersection of the IS and LM curves represents the equilibrium level of output and interest rates in an economy.

This mind map was published on 18 September 2023 and has been viewed 98 times.