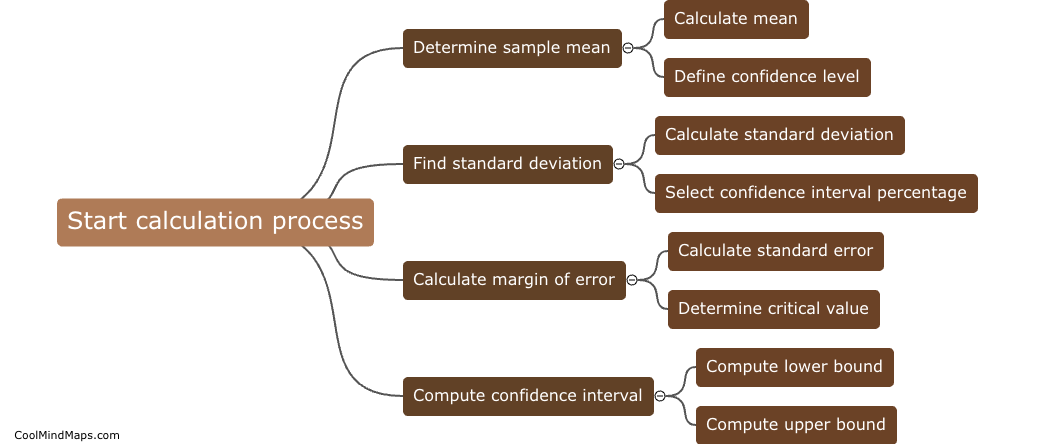
How can you interpret a confidence interval in R?
In R, a confidence interval can be interpreted as a range of values that we are reasonably confident contains the true population parameter. The confidence level associated with the interval indicates the probability that the interval will contain the true parameter if the sampling process is repeated multiple times. For example, a 95% confidence interval means that in 95 out of 100 samples, the interval will contain the true parameter. The width of the interval gives an estimate of the precision of the estimate, with narrower intervals indicating more precise estimates. Overall, interpreting a confidence interval in R involves understanding the range of values within which we believe the true parameter lies and the level of confidence we have in that estimate.

This mind map was published on 15 May 2024 and has been viewed 73 times.