How to perform basic statistical analysis in R?
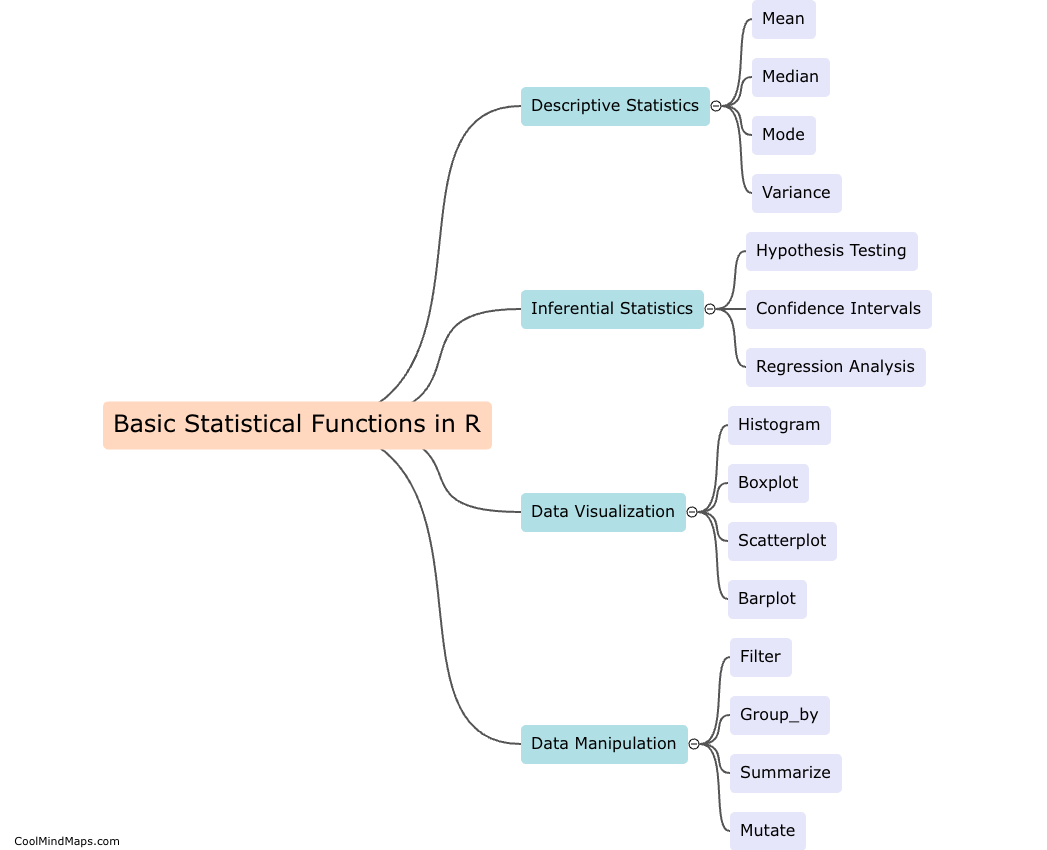
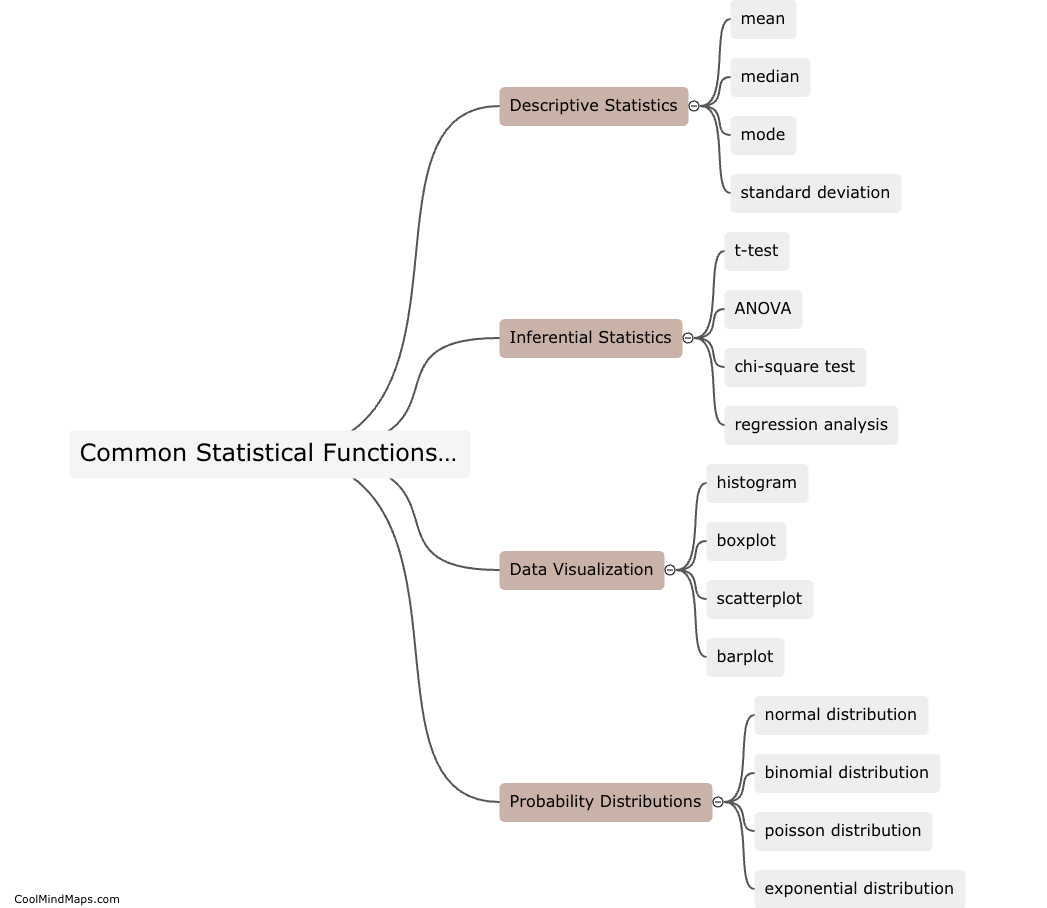
To perform basic statistical analysis in R, you can start by loading your data into the R environment and exploring it using functions like summary(), str(), or table(). Next, you can calculate descriptive statistics such as mean, median, standard deviation, and quartiles using functions like mean(), median(), sd(), and quantile(). For inferential statistics, you can conduct hypothesis testing using functions like t.test() or wilcox.test(), and perform regression analysis using functions like lm() for linear regression or glm() for generalized linear models. Visualizing your data using graphs and charts is also important for gaining insights and interpreting your results.

This mind map was published on 15 May 2024 and has been viewed 89 times.