How to use Power BI for data analysis?
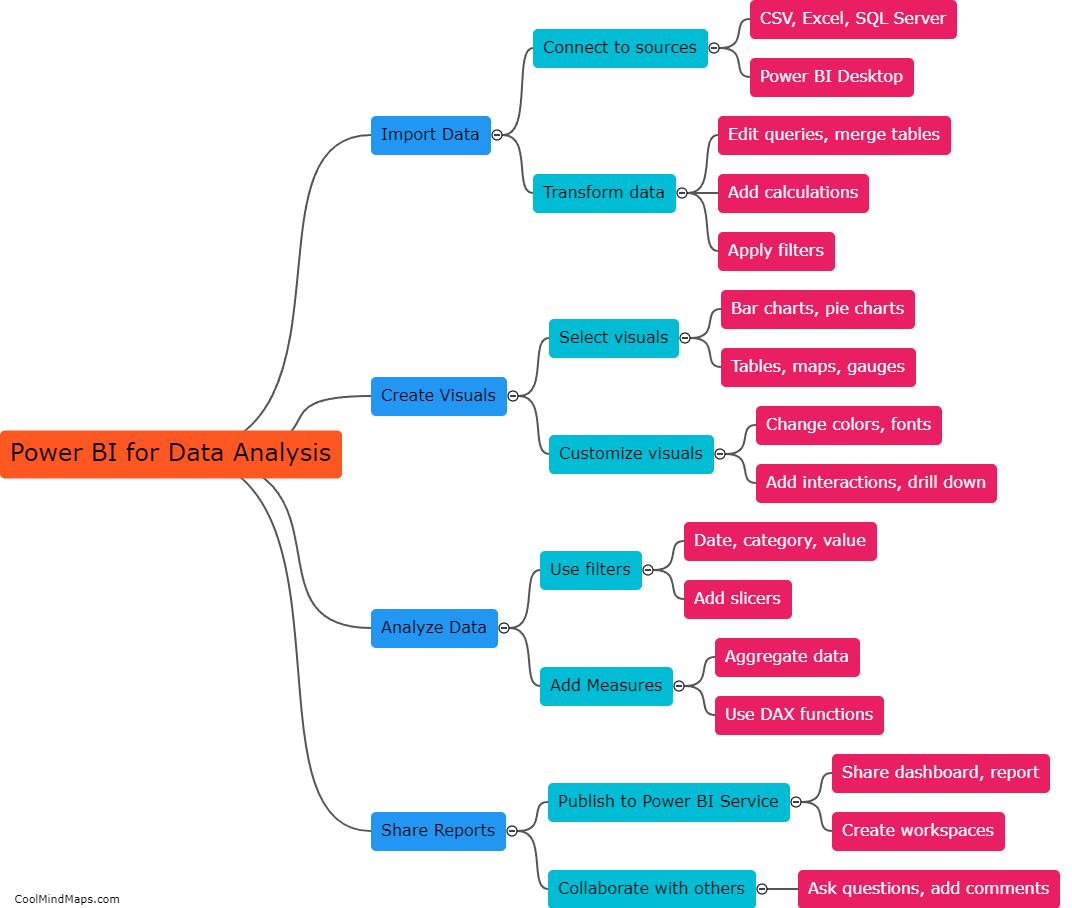
Power BI is a powerful data analysis tool that offers a range of interactive visualizations and business intelligence capabilities. To use Power BI for data analysis, start by connecting to your data source and creating a data model using the Power Query Editor. Then use the Report and Dashboard designers to create interactive visuals and share your insights with stakeholders. To get the most out of Power BI, it's essential to learn how to use DAX (Data Analysis Expressions) formulas, which allow you to define custom calculations and measures. With Power BI, you can quickly analyze large data sets, gain deep insights into your business, and make data-driven decisions to drive growth and profitability.
This mind map was published on 7 June 2023 and has been viewed 224 times.
