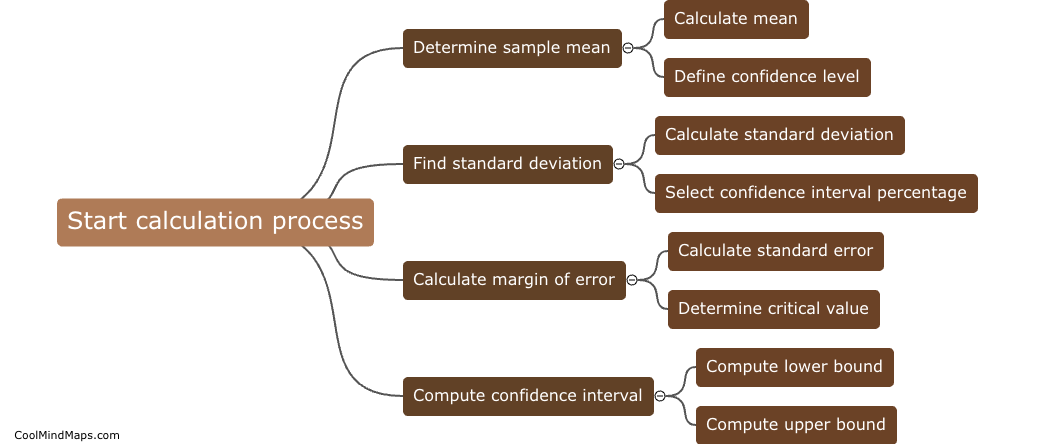
What does the confidence level represent in R?
In R, the confidence level represents the probability that a confidence interval will contain the true population parameter. For example, a 95% confidence level means that 95 out of 100 confidence intervals constructed in the same way will contain the true population parameter. The confidence level is typically expressed as a percentage, with common levels including 90%, 95%, and 99%. A higher confidence level indicates a greater degree of certainty in the accuracy of the estimate.

This mind map was published on 15 May 2024 and has been viewed 66 times.