How to interpret the results of a t-test in R?
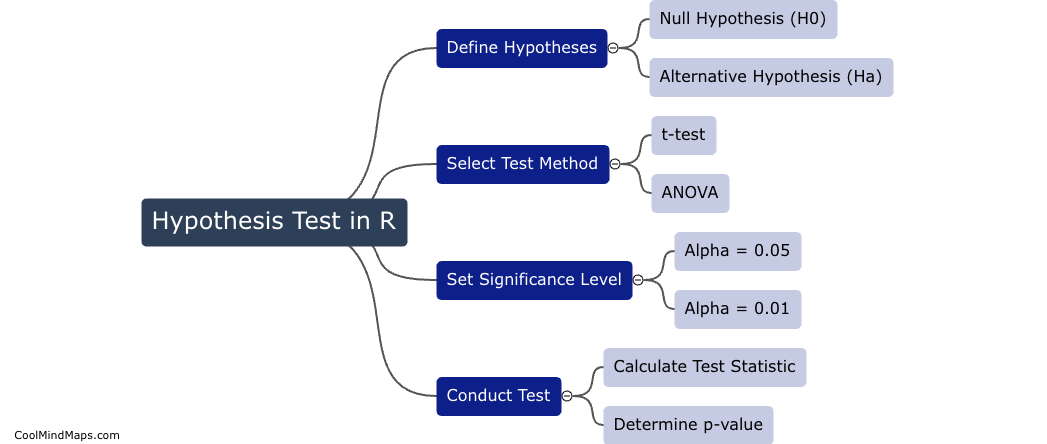
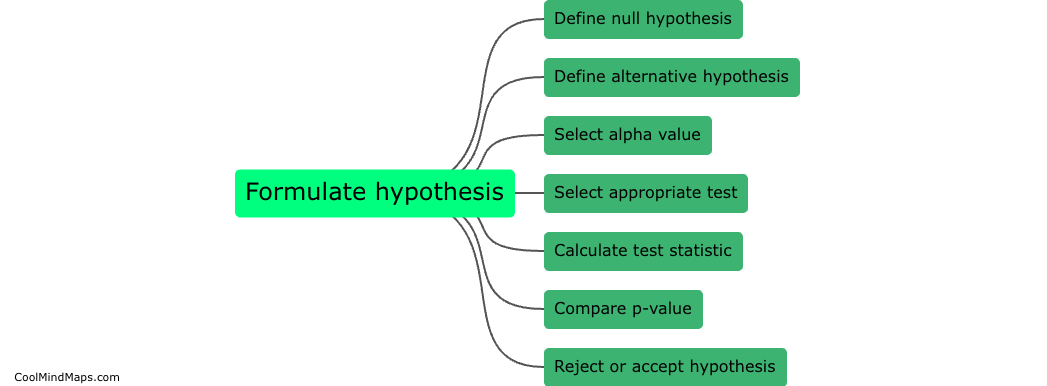
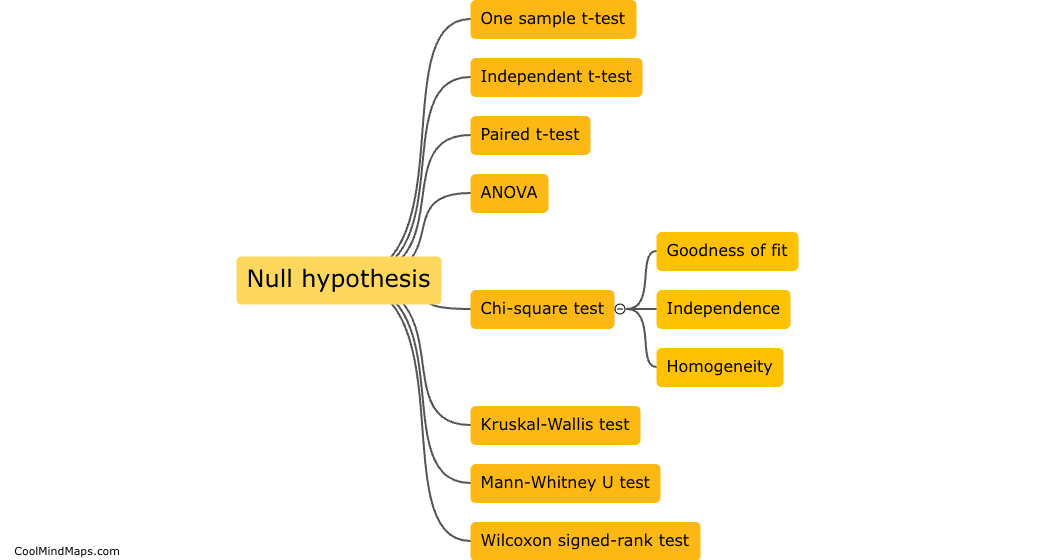
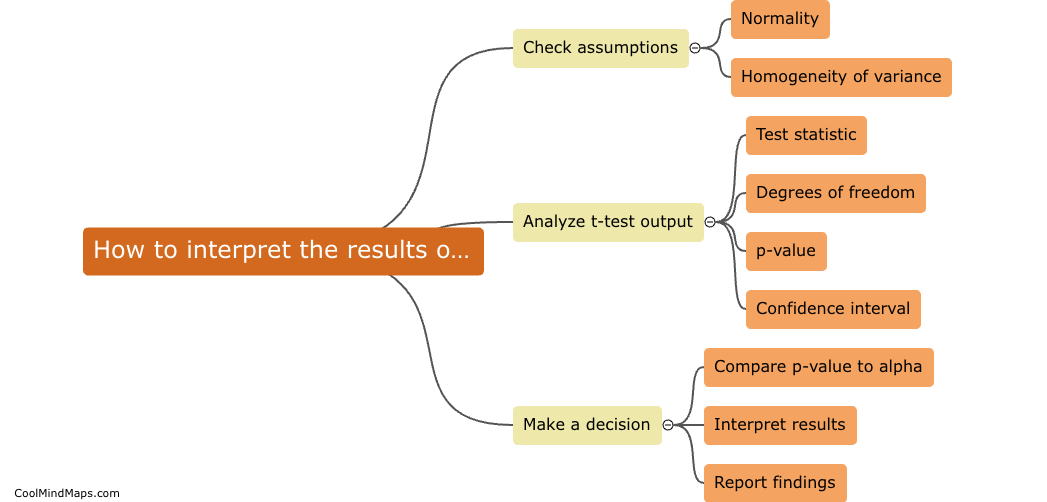
After performing a t-test in R to compare the means of two groups, it is important to interpret the results correctly. The output of a t-test in R typically includes the calculated t-statistic, degrees of freedom, and p-value. The t-statistic represents the difference between the means of the two groups relative to the variability within each group. The degrees of freedom indicate the amount of information available for estimating the population parameter. Finally, the p-value is the probability of obtaining a t-statistic as extreme as the one observed, assuming the null hypothesis (no difference between the groups) is true. A low p-value (typically ≤ 0.05) suggests that the difference between the groups is statistically significant. It is essential to consider these factors when interpreting the results of a t-test in R to draw valid conclusions from the analysis.
This mind map was published on 15 May 2024 and has been viewed 90 times.
