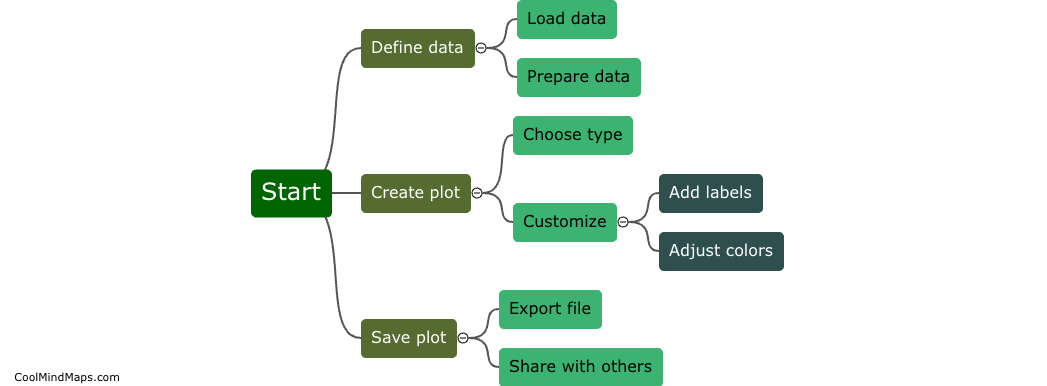
Can you show examples of R functions for plotting graphs?
Yes, there are several R functions available for plotting graphs. Some of the most commonly used functions include plot(), hist(), boxplot(), barplot(), scatterplot(), and ggplot(). These functions allow users to create a wide variety of visualizations, from simple scatter plots to complex multi-panel figures. Additionally, there are numerous packages in R, such as ggplot2, lattice, and plotly, that provide even more flexibility and customization options for creating high-quality graphs.

This mind map was published on 15 May 2024 and has been viewed 66 times.