How can GIS technology be used to analyze air pollution in the port area?
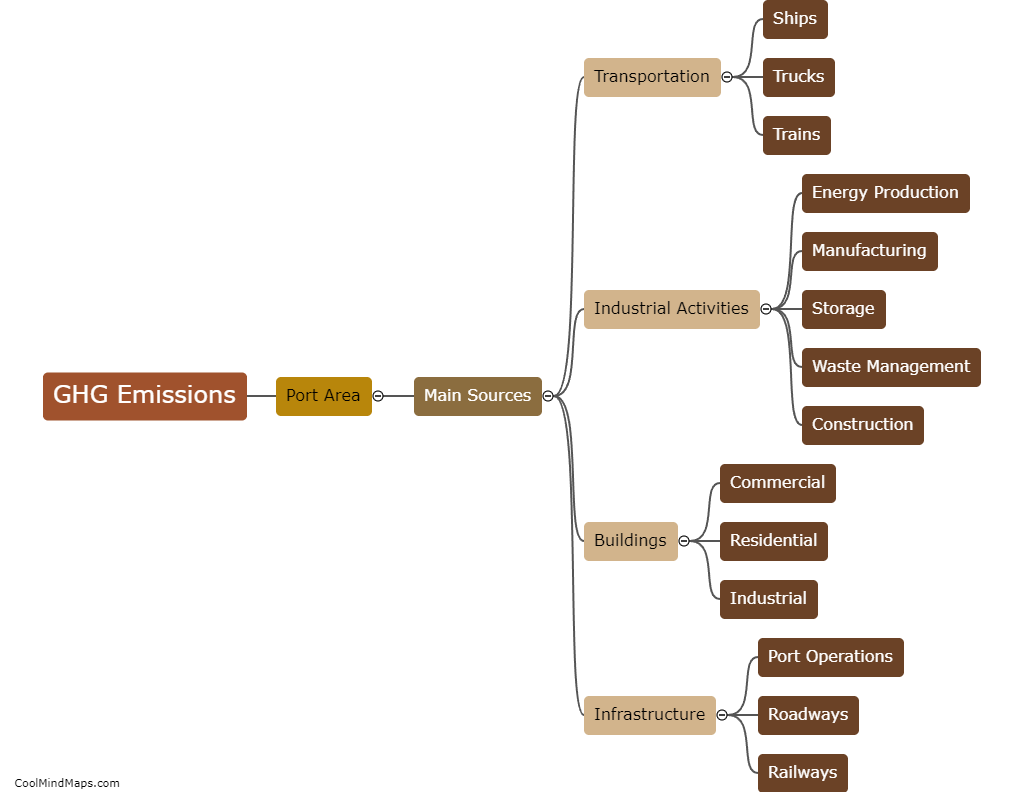
GIS technology can play a vital role in analyzing air pollution in the port area. With its ability to incorporate various data sets and geospatial information, GIS can effectively map and visualize the distribution of air pollution sources, such as industrial facilities and shipping activities, in the port area. By overlaying data on wind patterns and meteorological conditions, GIS can also capture the dispersion and movement of air pollutants, aiding in the identification of the most affected areas. Additionally, GIS can facilitate the integration of real-time monitoring data from air quality sensors, enabling instant analysis of pollution levels and the identification of hotspots. Such analysis can help port authorities and environmental agencies make informed decisions for pollution mitigation strategies, such as implementing emission control measures or optimizing traffic flow within the port area. Overall, GIS technology provides a powerful tool for understanding and addressing air pollution challenges in the port environment.

This mind map was published on 22 January 2024 and has been viewed 108 times.