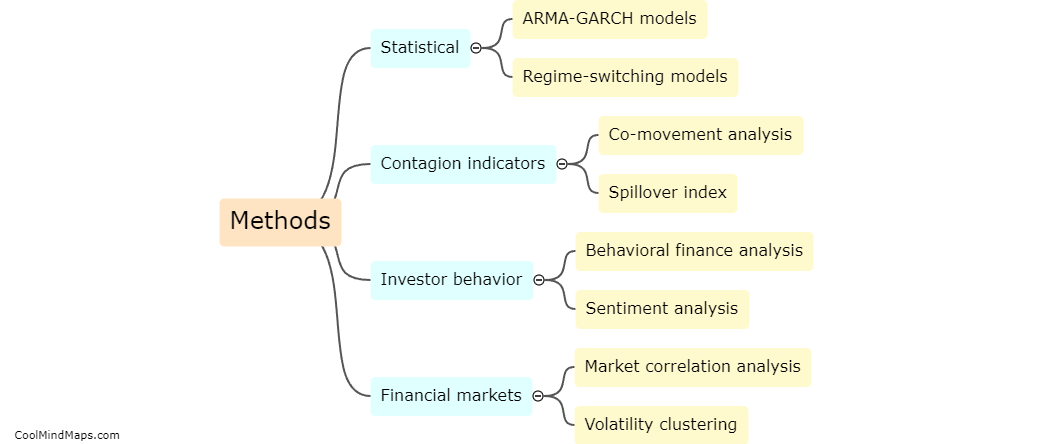
How can Fourier functions be used to determine volatility spillovers?
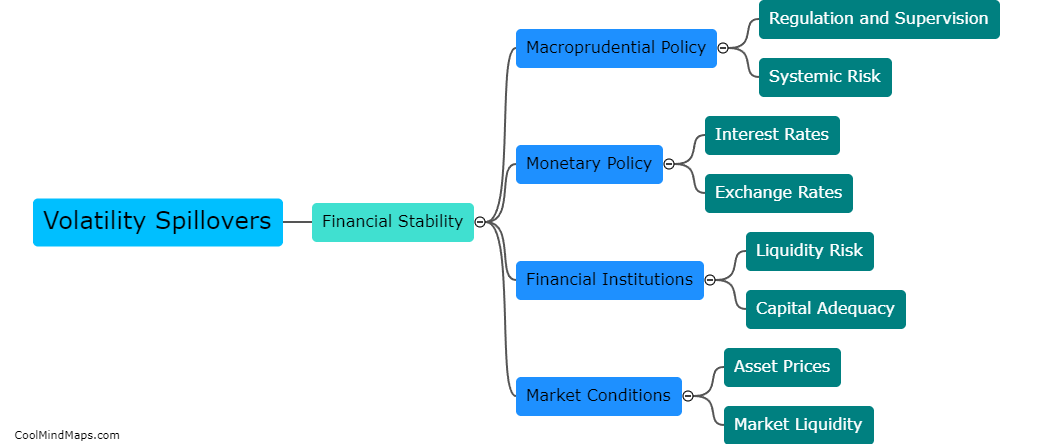
Fourier functions, which are mathematical tools used to represent a periodic function as a sum of sine and cosine functions, can be utilized to analyze volatility spillovers in financial markets. By applying this technique to time series data, such as stock prices or exchange rates, one can decompose the series into different frequency components. Volatility spillovers, which refer to the transmission of shocks between different assets or markets, can be detected by examining the components of the Fourier transform corresponding to different frequencies. High levels of volatility spillovers would indicate a strong interconnectedness or contagion between markets, while low levels would signify more isolated or independent behavior. This approach allows for a comprehensive assessment of the dynamics and transmission mechanisms of volatility spillovers, aiding in understanding and managing financial risk.

This mind map was published on 28 November 2023 and has been viewed 167 times.