How to read bank nifty charts?
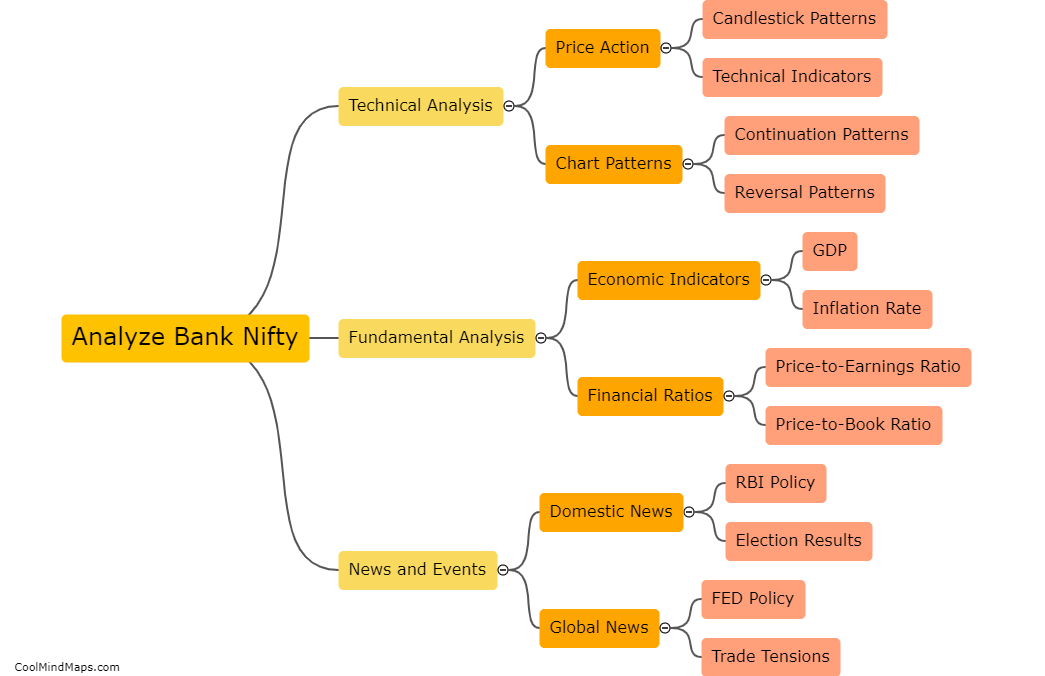
Bank Nifty charts can be read by following a few basic steps. First, look at the time frame of the chart, typically ranging from a few minutes to several years. Next, identify the trend by analyzing the highs and lows of the chart. You can also use technical indicators such as Moving Averages, Bollinger Bands, and MACD to confirm the trend. Support and resistance levels should also be noted to identify potential entry and exit points. Finally, keep an eye on any significant news or events that may impact the market and adjust your strategy accordingly. By regularly analyzing Bank Nifty charts, you can gain insights into market trends and make informed decisions about your investments.

This mind map was published on 17 May 2023 and has been viewed 118 times.