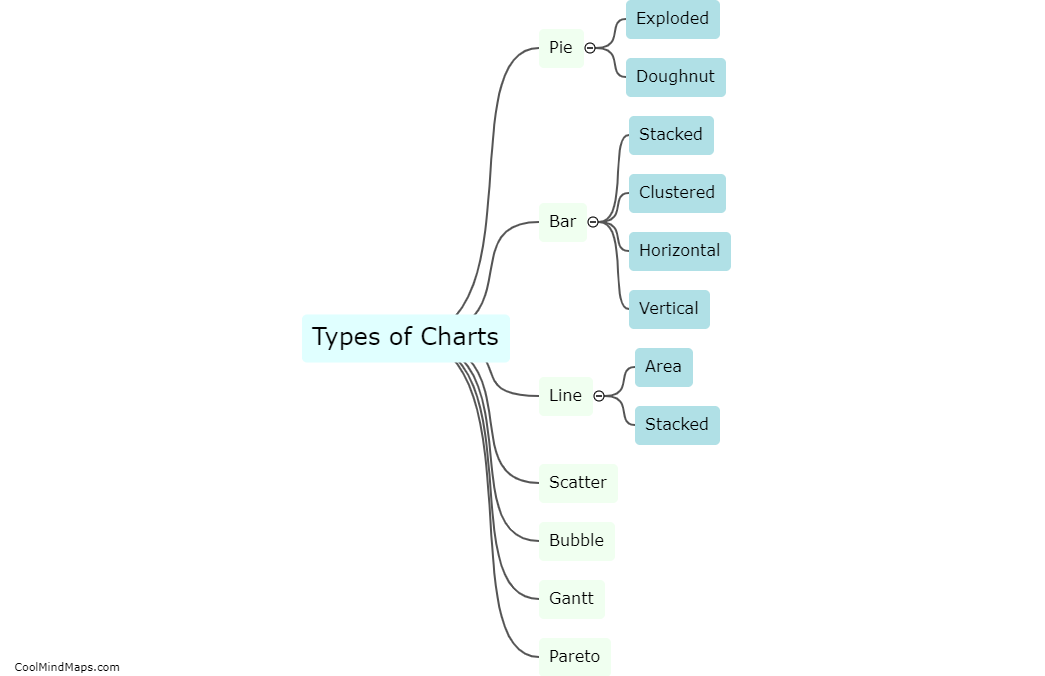
What are the different types of charts?
Charts are an important tool in presenting data in a visual way that is easy to understand. There are different types of charts that are used depending on the type of data being presented and the purpose of the chart. The most common types of charts include line charts, bar charts, pie charts, scatter plots, and flowcharts. Line charts are used to display trends over time, while bar charts are useful for comparing different categories. Pie charts are commonly used to show percentages, while scatter plots are used to show the relationship between two variables. Flowcharts are diagrams that are used to represent a process or system. Each type of chart has its own advantages and disadvantages, and choosing the right chart type is crucial for effectively presenting data.
This mind map was published on 9 May 2023 and has been viewed 112 times.
