What is an Excel dashboard?
An Excel dashboard is a visual representation that consolidates data from multiple sources and displays it in a format that is easy to understand and interact with. It allows users to visualize key performance indicators (KPIs) and track progress towards goals. Dashboards can be customized to include graphs, charts, and tables, making it easy to identify trends and patterns. They are commonly used in business, finance, and other industries to monitor performance and make data-driven decisions. Excel dashboards can be created using built-in tools in Excel or through specialized software.
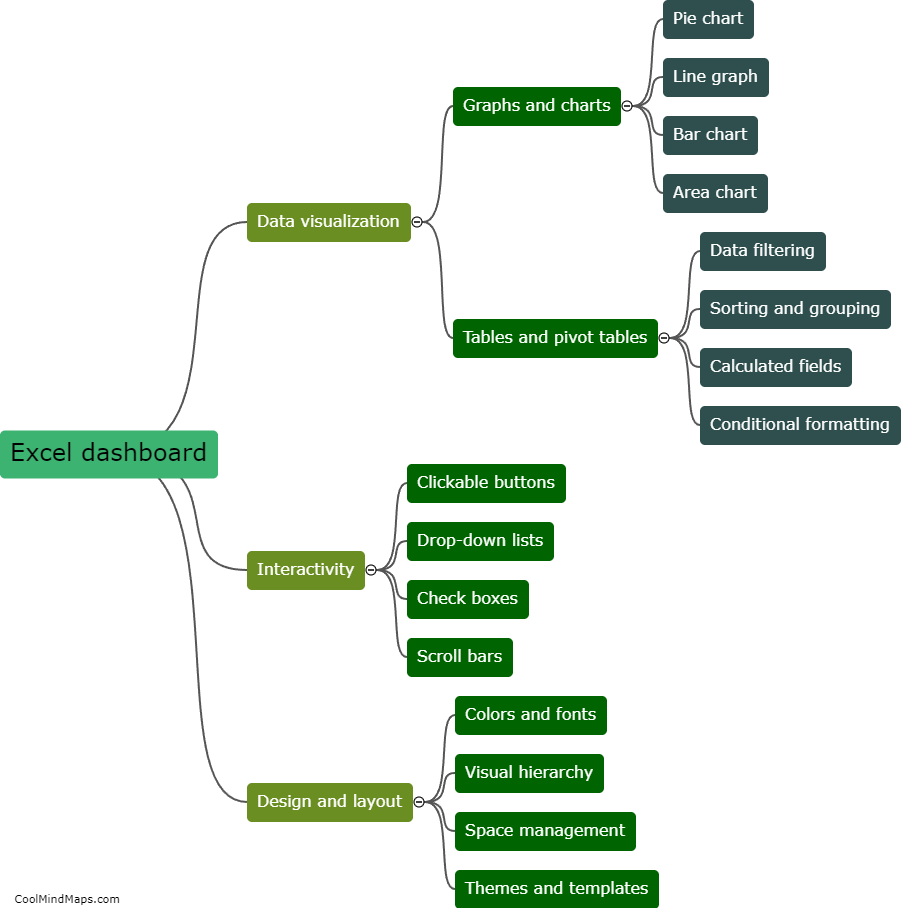
This mind map was published on 16 May 2023 and has been viewed 113 times.
